HOW TO MAKE A GRAPH USING ANDROID STUDIO AND THE PLTOUCH – (Part 3) Finalization

In this lesson we show to finalize the graph we just made.

First of all with the “getData()” function, get all your data e put into one/or more variables, than add one/or more parameters for every day of the week you putted in:


	int[][] datas = getData();	 	// calls a user created function tha gets all the data from source
	int[] d= datas [0];
	yAx2.add(new Entry(d[0],0)); 		// it requires a new Entry, Entry requires a numeric value, and for 2th argument an Integer index
	yAx2.add(new Entry(d[1],1));
	yAx2.add(new Entry(d[2],2));
	yAx2.add(new Entry(d[3],3));
	yAx2.add(new Entry(d[4],4));
	yAx2.add(new Entry(d[5],5));
	yAx2.add(new Entry(d[6],6));

Than activate the zoom and scroll, you can even set move limits for its Axis and other stuff.


	lc.setVisibleXRangeMaximum(65f);					//Sets the max visible field on the x Axis
        lc.setVisibleYRangeMaximum(50, YAxis.AxisDependency.LEFT);		//Sets the max visible field on the y Axis
        lc.setTouchEnabled(true);						//Activates the touch Control
        lc.setDragEnabled(true);						//Enables dragging
        lc.getAxisLeft().setAxisMinValue(0);					//Set minimum axis Zoom level
        lc.getAxisLeft().setAxisMaxValue(50);					//Set maximum axis Zoom level
        lc.setScaleMinima(0, 1);						//Set the graph total scale, from min to max
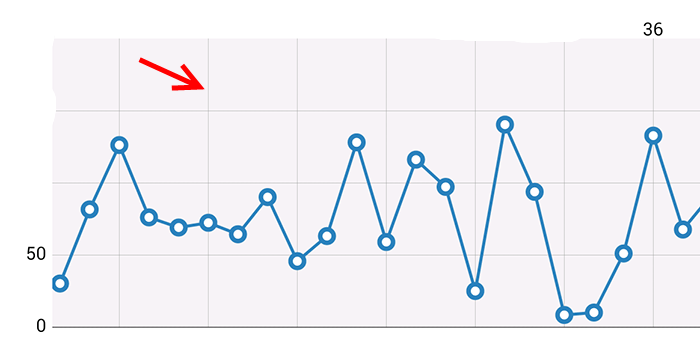
And… we have so easely made our graph!
HOW TO MAKE A GRAPH USING ANDROID STUDIO AND THE PLTOUCH – (Part 1) Initiation

In this example we are going to show you how to create a Graph with Android studio on our PlTouch devices. To make the graph, we need to use an external library called MpAndroidChart, that you can find here, otherwise without downloading it, you can include into the grade build file in the next stage.

This Article divides into 3 posts, Initiation, Data Setup, Finalization.

Fist of all, open one of your projects or create a new one, keeping in mind that you can put the graph itself on a specific Activity or you can directly call it under Main Activity.

If you want to import the Library by downloading it, and you don’t know how to import it in Android Studio, here’s a tutorial that fits your need, otherwise,

just follow the build gradle procedure:

LINKING BY BUILD GRADLE:
Go to your gradle.build file and paste in the following lines of code, be aware to put those outside application.

<code>
repositories {
 maven { url 'https://jitpack.io' }
}

dependencies {
 compile fileTree(include: ['*.jar'], dir: 'libs')
 androidTestCompile('com.android.support.test.espresso:espresso-core:2.2.2', {
 exclude group: 'com.android.support', module: 'support-annotations'
 })
 compile 'com.github.PhilJay:MPAndroidChart:v2.2.4'
 compile 'com.android.support:appcompat-v7:25.3.1'
 compile 'com.android.support:design:25.3.1'
 compile 'com.android.support.constraint:constraint-layout:1.0.2'
 testCompile 'junit:junit:4.12'
}

</code>

Fine, now the libray that will allow you to make the graph, has included into the project!
In the next post we are going to see how to initiate every Component correctly, stay tuned.

HOW TO MAKE A GRAPH USING ANDROID STUDIO AND THE PLTOUCH – (Part 2) Data Setup

First thing, we need to put the graph into the layou.xml file, to do this, search in the layout designer the lineChart tag, and put it in, or just type it by hand into the xml file.

At this point we need to declare some variables, that will allow us to communicate with other inner elements of Plugin/Library:


    LineChart lc; 				//lineChart Main Component
    ArrayList<String> xAx2;			//xAxis titles Array
    ArrayList<Entry> yAx2;			//yAx entry Array (Values associated with an index)
    ArrayList<ILineDataSet> dss;		//multidimensional Array containing the whole DataSet
    LineDataSet lds;			//the DataSet Component


Than we are going to Initiate every component, in your Activity on the onCreate method:


    lc = (LineChart) findViewById(R.id.lnCH1);		//xml layout Id Reference
    dss = new ArrayList<>();				//Initiate the DataSet Component as an empty Array
    xAx2 = new ArrayList<>();				//Initiate xAxis titles as an empty Array
    yAx2 = new ArrayList<>();				//Initiate yAxis values as an empty Array

After that, we need need to put our data unto the graph, to do this, first of all, we decide how to save the datas that are going to be put to the graph.
– WITH TEXT FILES Go to Tutorial
– WITH DATABASE/S

After created our Data Save System, and after instatiation, and after you have check some statement on your code, create a function to load the saved data, and in this example
we call that function “getData()”

Add to the ArrayList every day of the week, this data are going to be put to the graph like titles.


        xAx2.add("LUNEDI");		//It only adds a string parameter to the xAxis of the Graph as a Title
        xAx2.add("MARTEDI");
        xAx2.add("MERCOLEDI");
        xAx2.add("GIOVEDI");
        xAx2.add("VENERDI");
        xAx2.add("SABATO");
        xAx2.add("DOMENICA");

In the next post we are going to see how put some values to the graph, and complete the configuration, stay tuned.

Add a custom Library, on Android Studio

In this example we are going to show you, how to import a Custom Library on Android Studio.

First of all, open one of you projects or create a new one.

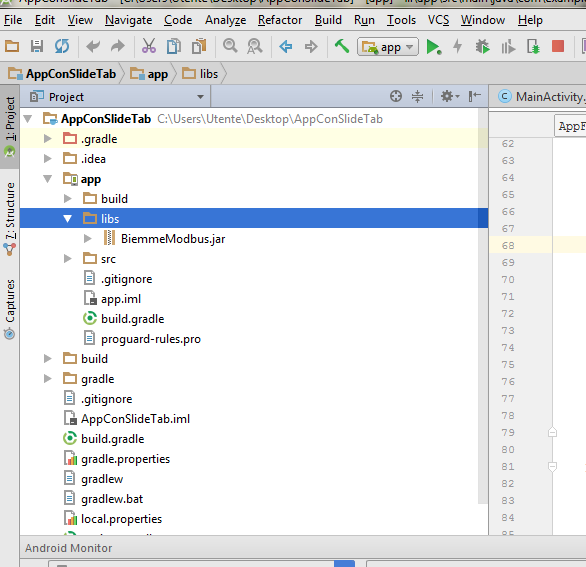
Click on the DropDown menu that you find on the left-top corner of the screen, under the File Menu, scroll options until you find the word Project and click it.

Copy your Library with a Jar format in the Lib folder, that you can find at ProjectName/App/Lib

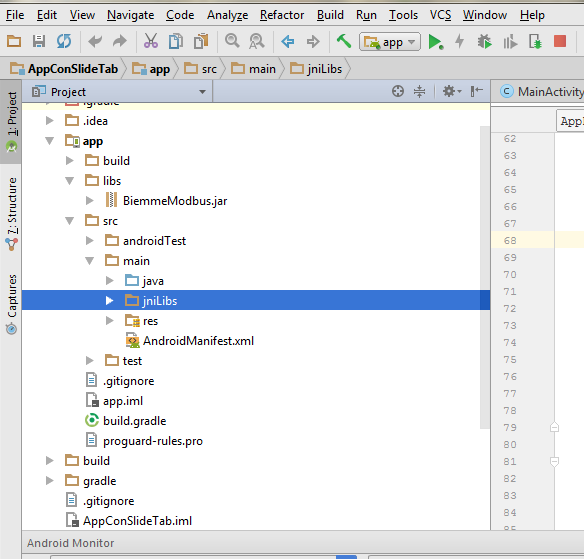
If you have .so files associated to the Library, you have to copy those under the JniLib folder, if it doesn’t exist you have to create it, precisely on the path ProjectName/App/Src/Main

immagine1

Select the Librart that you just imported on the Lib folder by left clicking and click on “Add as Library!”

immagine1

so the import, has just been completed.