PID controller Android

La BieMme è orgogliosa di annunciare di aver sviluppato una libreria dedicata ai pannelli Ltouch7 GS che permetto l’utilizzo della funzione PID. Grazie al sistema operativo Android sarà molto più facile creare e personalizzare le tue esigenze.

Non vi servirà altro che solamente un nostro HMI Android Ltouch7 GS che ha di serie due ingressi analogici con risoluzione fino a 17bit, 4 uscite a relè oppure la linea RS485 Modbus che permette l’interfaciamento con sucessiva modulazione a dispositivi slave.

La libreria ha il nome di MathProcess, con molteplici funzionalità e personalizzazioni. Di seguito alcuni metodi disponibili:

  • String GetVersion();
    restituisce la versione della libreria in uso
  • int InitPid(char channels):
    Anzitutto chiamare questa funzione per dichiarare il numero di canali richiesti
    channels : numero di canali da gestire
    valori di ritorno : EXIT_FAIL, EXIT_OK
  • void ClosePid()
    chiamare alla chiusura dell’applicazione per liberare le risorse allocate
  • double[] ChangePidGains(char ch, double p_gain, double i_gain, double d_gain)
    imposta i guadagni per il canale selezionato
    restituisce i guadagni applicati
  • double[] GetPidSettings(char ch)
    restituisce le impostazioni in uso per il canale impostato: p_gain, i_gain, d_gain , inverted state (true se invertito, false altrimenti)
  • public native int SetPidCh(boolean inverted, char ch, double p_gain, double i_gain, double d_gain, int sample_time_ms, int pulse_time_ms, double refval, double maxval, double minval);
    boolean inverted:
    char ch: canale da configurare
    double p_gain, double i_gain, double d_gain : guadagni
    int sample_time_ms : tempo in ms tra 2 elaborazioni
    int pulse_time_ms : durata dell’impulso nell’ uscita a relè (durata dell’impulso intesa come somma del tempo in cui l’uscita è alto e in cui è bassa)
    double refval : valore target per il segnale
    double maxval : valore massimo per il segnale oltre cui non si deve salire
    double minval : valore minimo per il segnale oltre cui non si deve scendere
  • public native int PidLoop(double []inputs,double []outputs);
    double []inputs :vettore conente le acquisizioni dagli ingressi analogici
    double []outputs : vettore contenente i valori calcolati dalla libreria pid

La funzione MathProcess.SetPidCh dovrà essere richiamata ciclicamente attraverso un thread, questa potrà comandare dei relè a bordo oppure modulare altri dispositivi attraverso la porta seriale Modbus di serie.

Libreria PID Android HMI

La BieMme è orgogliosa di annunciare di aver sviluppato una libreria dedicata ai pannelli Ltouch7 GS che permetto l’utilizzo della funzione PID. Grazie al sistema operativo Android sarà molto più facile creare e personalizzare le tue esigenze.

Non vi servirà altro che solamente un nostro HMI Android Ltouch7 GS che ha di serie due ingressi analogici con risoluzione fino a 17bit, 4 uscite a relè oppure la linea RS485 Modbus che permette l’interfaciamento con sucessiva modulazione a dispositivi slave.

La libreria ha il nome di MathProcess, con molteplici funzionalità e personalizzazioni. Di seguito alcuni metodi disponibili:

  • String GetVersion();
    restituisce la versione della libreria in uso
  • int InitPid(char channels):
    Anzitutto chiamare questa funzione per dichiarare il numero di canali richiesti
    channels : numero di canali da gestire
    valori di ritorno : EXIT_FAIL, EXIT_OK
  • void ClosePid()
    chiamare alla chiusura dell’applicazione per liberare le risorse allocate
  • double[] ChangePidGains(char ch, double p_gain, double i_gain, double d_gain)
    imposta i guadagni per il canale selezionato
    restituisce i guadagni applicati
  • double[] GetPidSettings(char ch)
    restituisce le impostazioni in uso per il canale impostato: p_gain, i_gain, d_gain , inverted state (true se invertito, false altrimenti)
  • public native int SetPidCh(boolean inverted, char ch, double p_gain, double i_gain, double d_gain, int sample_time_ms, int pulse_time_ms, double refval, double maxval, double minval);
    boolean inverted:
    char ch: canale da configurare
    double p_gain, double i_gain, double d_gain : guadagni
    int sample_time_ms : tempo in ms tra 2 elaborazioni
    int pulse_time_ms : durata dell’impulso nell’ uscita a relè (durata dell’impulso intesa come somma del tempo in cui l’uscita è alto e in cui è bassa)
    double refval : valore target per il segnale
    double maxval : valore massimo per il segnale oltre cui non si deve salire
    double minval : valore minimo per il segnale oltre cui non si deve scendere
  • public native int PidLoop(double []inputs,double []outputs);
    double []inputs :vettore conente le acquisizioni dagli ingressi analogici
    double []outputs : vettore contenente i valori calcolati dalla libreria pid

La funzione MathProcess.SetPidCh dovrà essere richiamata ciclicamente attraverso un thread, questa potrà comandare dei relè a bordo oppure modulare altri dispositivi attraverso la porta seriale Modbus di serie.

How to measure a level trought analog inputs and with LtouchGS

Our LtouchGS product is ideally suited for the industrial environment, where analog signals are to be acquired.
LtouchGS comes standard with two analog inputs, voltage or current, with a resolution of 17 bits.
In this article, we explain the main steps to create an application that detects a tank level and then triggers an alarm and sends it via email.

First we need to connect our level sensor with 0.20 mA analog output to our input, following this image.

We must respect the polarity and so we connect the ground of power supply wire to the GND terminal of the Ltouch.
The output wire of sensor must be connected to the current mA terminal of the Ltouch.

Finally, the code for this setup is very simple. The following diagram measures the 0-20mA signals on channel 1, with a resolution of 17 bits, and maps the current over a level range. This mapping will depend on the transmitter, the example below maps from 0 mA to 0 cm and from 20 mA to 100 cm.

Now let’s move on to the code part for the APP:

You can use the library BMTouch to configure and read the values in to android studio.

View this for download library 

View this for how to use BMtouch Library

To configure the sampling frequency directly write the value of the frequency and scale through the library subito dopo protected void onCreate :

BMTouch.ADC_set_scale((byte) 0, (byte) 0, 1);

BMTouch.ADC_set_frequency((byte) 0, 15);

Now we can call the library function to read the analog value through a single call or by creating a TimerTask that executes this cyclically, you can see on this video how to do it.

ch1_val = BMTouch.ADC_read_channel((byte) 0, (byte)0);

ich1_val returns the value read from 0 to 32768, it is up to us to know that 32768 is hight 100 cm, so we can make a portion and find the quantity of the tank.

To send an email at a minimum or maximum threshold, we can watch this video that explains in detail how to send an email through gmail.

that’s all, if you have any doubts or requests, contact us by email.

PT100 with 4-20mA transmitter connect up to 2 PT100s to an Android Ltouch7 GS

The PT100 and PT1000 are standard industrial temperature sensors (RTD = Resistance Temperature Detectors) that can easily be used with an Ltouch43 and Ltouch7GS by adding a 4-20mA transmitter that converts the measured resistance into a 4-20mA signal.

The PT100 sensor comes with 2, 3, or 4 wires. 2 wires give us the resistance of the sensor PLUS the leads, so we can’t be sure about the exact sensor resistance. 3 wires solve this by adding a wire to one side, so we can measure also the resistance of 1 lead wire, and assume the other one is similar. 4 wires allow us to measure the resistance of both lead wires. More details here.

A common way to use the PT100 is to add a transmiter, that converts the resistance into a 4-20mA signal. Such current loop is stable over long cable lengths. In this example we use a K109PT transmitter which can handle 2,3,4 wire PT100 sensors, and has programmable ranges and error handling.

The Ltouch7 GS has 2 analog input channels, we can connect up to 2 PT100 sensors. In below example we connect 1.

This is a close-up of our transmitter:

  • PT100 connected with 3 wires, on terminals 2, 3, 4 as per Seneca datasheet. the sensor resistance is between terminal 2 and 3 (red and white wires)
  • The converter needs a separate power supply and we connect the 24Vdc to terminals 7 and 8
  • We connect the current signal coming out of the K109PT board to the analog input of our Ltouch7 GS. We must respect the polarity and so we connect the gray wire to the GND terminal of the Ltouch.
  • The orange wire must be connected to the current mA terminal of the Ltouch
Finally, the code for this setup is very simple. The following diagram measures the 0-20mA signals on channel 1, with a resolution of 17 bits, and maps the current over a temperature range. This mapping will depend on the transmitter, the example below maps from 0 mA to 0 degrees and from 20 mA to 100 degrees (constants defined by the dip switches).
Now let’s move on to the code part for the APP:

You can use the library BMTouch to configure and read the values in to android studio.

View this for download library 

View this for how to use BMtouch Library

To configure the sampling frequency directly write the value of the frequency and scale through the library subito dopo protected void onCreate :

BMTouch.ADC_set_scale((byte) 0, (byte) 0, 1);

BMTouch.ADC_set_frequency((byte) 0, 15);

Now we can call the library function to read the analog value through a single call or by creating a TimerTask that executes this cyclically :

ch1_val = BMTouch.ADC_read_channel((byte) 0, (byte)0);

ch1_val returns the value read from 0 to 32768, it’s up to us to multiply it by 100 and divide by 32768 to find the temperature.

temp = (ch1_val*100)/32768;

that’s all, if you have any questions please contact us

PT100 with 4-20mA transmitter

The PT100 and PT1000 are standard industrial temperature sensors (RTD = Resistance Temperature Detectors) that can easily be used with an Ltouch43 and Ltouch7GS by adding a 4-20mA transmitter that converts the measured resistance into a 4-20mA signal.

The PT100 sensor comes with 2, 3, or 4 wires. 2 wires give us the resistance of the sensor PLUS the leads, so we can’t be sure about the exact sensor resistance. 3 wires solve this by adding a wire to one side, so we can measure also the resistance of 1 lead wire, and assume the other one is similar. 4 wires allow us to measure the resistance of both lead wires. More details here.

A common way to use the PT100 is to add a transmiter, that converts the resistance into a 4-20mA signal. Such current loop is stable over long cable lengths. In this example we use a K109PT transmitter which can handle 2,3,4 wire PT100 sensors, and has programmable ranges and error handling.

The Ltouch7 GS has 2 analog input channels, we can connect up to 2 PT100 sensors. In below example we connect 1.

This is a close-up of our transmitter:

  • PT100 connected with 3 wires, on terminals 2, 3, 4 as per Seneca datasheet. the sensor resistance is between terminal 2 and 3 (red and white wires)
  • The converter needs a separate power supply and we connect the 24Vdc to terminals 7 and 8
  • We connect the current signal coming out of the K109PT board to the analog input of our Ltouch7 GS. We must respect the polarity and so we connect the gray wire to the GND terminal of the Ltouch.
  • The orange wire must be connected to the current mA terminal of the Ltouch
Finally, the code for this setup is very simple. The following diagram measures the 0-20mA signals on channel 1, with a resolution of 17 bits, and maps the current over a temperature range. This mapping will depend on the transmitter, the example below maps from 0 mA to 0 degrees and from 20 mA to 100 degrees (constants defined by the dip switches).
Now let’s move on to the code part for the APP:

You can use the library BMTouch to configure and read the values in to android studio.

View this for download library 

View this for how to use BMtouch Library

To configure the sampling frequency directly write the value of the frequency and scale through the library subito dopo protected void onCreate :

BMTouch.ADC_set_scale((byte) 0, (byte) 0, 1);

BMTouch.ADC_set_frequency((byte) 0, 15);

Now we can call the library function to read the analog value through a single call or by creating a TimerTask that executes this cyclically :

ch1_val = BMTouch.ADC_read_channel((byte) 0, (byte)0);

ch1_val returns the value read from 0 to 32768, it’s up to us to multiply it by 100 and divide by 32768 to find the temperature.

temp = (ch1_val*100)/32768;

that’s all, if you have any questions please contact us

Come creare un grafico in Android usando la libreria jjoe64/GraphView

In questo breve tutorial vedremo come realizzare un grafico in Android Studio per i nostri dispositivi Ltouch, utilizzando la libreria esterna jjoe64/GraphView in pochi e semplici passaggi. L’esempio da noi proposto andrà a realizzare un grafico avente come asse delle ascisse il tempo trascorso e come asse delle ordinate l’andamento della temperatura. Quest’ultima data da una sonda di temperatura PT100 collegata al dispositivo tramite ingresso analogico ( nulla vieta che la comunicazione possa avvenire in Modbus RTU ). I dati vengono letti e scritti su di una tabella ( temperature_table ) all’interno di un database locale ( DB_CHART.db ) ma in questa guida ci occuperemo solo della lettura quindi consiglio la visione del seguente articolo .
Nel caso in cui un passaggio dovesse essere poco chiaro oppure abbiate bisogno di maggiori informazioni ( per quanto riguarda la realizzazione del grafico ) tutto il materiale da cui attingere è reperibile al seguente indirizzo.
Detto ciò, il primo passaggio prevede di implementare la dipendenza nel build.gradle tramite il seguente comando:

implementation 'com.jjoe64:graphview:4.2.2'

Nel secondo passaggio invece si dovrà aprire il file xml dell’attività ( Es. layout/activity_main.xml ) e aggiungere il tag per creare il grafico vero e proprio ( disporlo all’interno a piacimento ):

Nel terzo passaggio:
-Per prima cosa inizializziamo le variabli…

LineGraphSeries dataseries = new LineGraphSeries<>(new DataPoint[0]);
SimpleDateFormat sdf = new SimpleDateFormat("MM/dd/yyyy\nHH:mm:ss");
//Nell'onCreate()
mioGrafico = (GraphView) findViewById(R.id.TempChart);

-Dopo di che dando per scontato che il database si già popolato, utilizzo il metodo getAllData() contenuto nella classe DatabaseHelper in questo modo:

//Ottengo i vari DataPoint ( valoreX, valoreY ) da applicare in seguito al grafico
dataseries.resetData(mioDBHelper.getAllData());

Il metodo getAllData() non fa altro che un SELECT di tutti i dati all’interno della tabella ( temperature_table ) e crea un vettore DataPoint ( che è quello che poi restituisce ). Quest’ultimo contiene i vari punti del grafico ovvero l’associazione ( asseX / asseY ) dove per asseX si intende prendere il valore della riga la cui corrispondente colonna è rappresentata da Time ( in Unix timestamp ) mentre per asseY si intende prendere il valore della riga per cui la corrispondente colonna è rappresentata da Temperature:

/**
* Metodo per ottenere tutti i dati presenti all'interno della tabella temperature_table
* ( anche se alla fine tengo conto solo delle colonne Time e Temperature
* @return : DataPoint[]
*/
public DataPoint[] getAllData(){
//Ottengo il DB in modalità lettura
SQLiteDatabase mioDB = this.getReadableDatabase();
//Creo un oggetto Cursor per selezionare tutti i dati all'interno della tabella
Cursor mioCursor = mioDB.rawQuery("SELECT * FROM "+TABLE_name,null);
//Istanzio DataPoint di dimensione pari a mioCursore.getCount() ( ovvero pari al numero di
// righe )
DataPoint[] mieiDataPoint = new DataPoint[mioCursor.getCount()];
//Con questo ciclo creo i vari datapoint (x,y) e prendo min e max di entrambi gli assi
for(int i = 0; i < mioCursor.getCount(); i++){
mioCursor.moveToNext();
if (i == 0){
MinX = mioCursor.getInt(mioCursor.getColumnIndex("Time"));
MinY = mioCursor.getDouble(mioCursor.getColumnIndex("Temperature"));
}
if(i == (mioCursor.getCount()-1)){
MaxX = mioCursor.getInt(mioCursor.getColumnIndex("Time"));
MaxY = mioCursor.getDouble(mioCursor.getColumnIndex("Temperature"));
}
mieiDataPoint[i] = new DataPoint(mioCursor.getInt(mioCursor.getColumnIndex("Time")),mioCursor.getDouble(mioCursor.getColumnIndex("Temperature")));
}
//Chiudo il db ( aperto in modalità lettura )
mioDB.close();
return mieiDataPoint;
}

A questo punto non rimane altro da fare che il seguente comando per caricare DataPoint[] all’interno del grafico

mioGrafico.addSeries(dataseries);

Nel caso in cui si voglia ottenere un qualcosa di più elaborato propongo di seguito un’altro esempio

//Imposto colore della linea del grafico
dataseries.setColor(Color.GREEN);
//Imposto se mettere o meno i punti ( in questo caso si )
dataseries.setDrawDataPoints(true);
//Imposto il raggio dei punti
dataseries.setDataPointsRadius(5);
//Imposto la grossezza della linea
dataseries.setThickness(3);
/*
Per settare maualmente l'asse y...
mioGrafico.getViewport().setYAxisBoundsManual(true);
mioGrafico.getViewport().setMinY(mioDBHelper.getMinY());
mioGrafico.getViewport().setMaxY(mioDBHelper.getMaxY())
*/
//Setto manualmente l'asse x
mioGrafico.getViewport().setXAxisBoundsManual(true);
//Specifico valore minimo asse x
mioGrafico.getViewport().setMinX(mioDBHelper.getMinX());
//Specifico valore massimo asse x
mioGrafico.getViewport().setMaxX(mioDBHelper.getMaxX());
//Do la possibilità di fare lo zoom e lo scroll
mioGrafico.getViewport().setScalable(true);
mioGrafico.getGridLabelRenderer().setHumanRounding(false); //In quanto uso data e ora come asse delle x
//Aggiungo al grafico i DataPoint
mioGrafico.addSeries(dataseries);

Il risultato ottenuto dovrebbe essere simile a quello in figura:

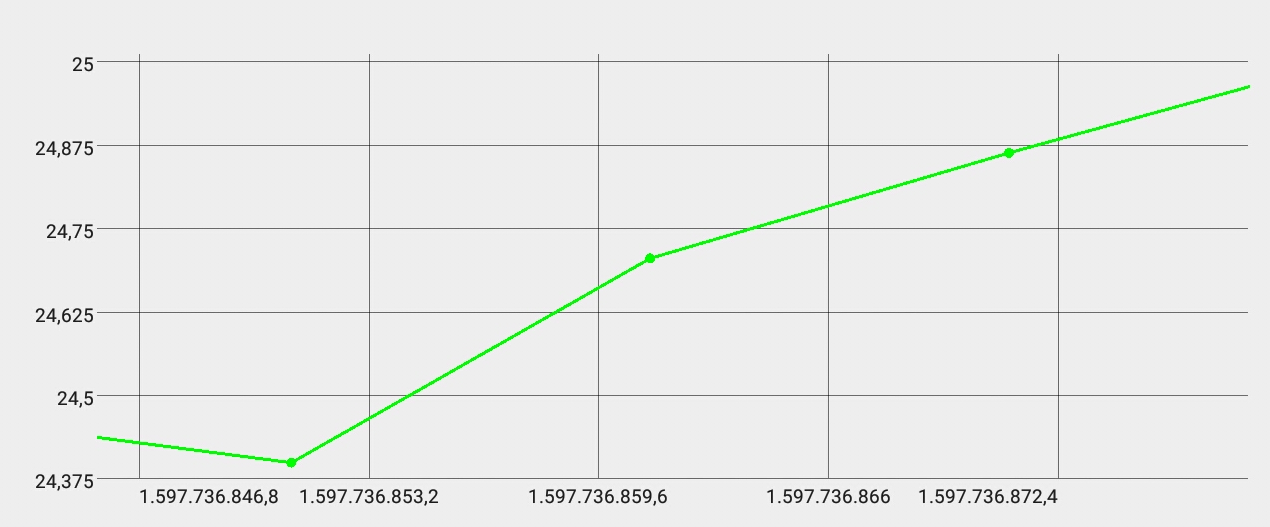
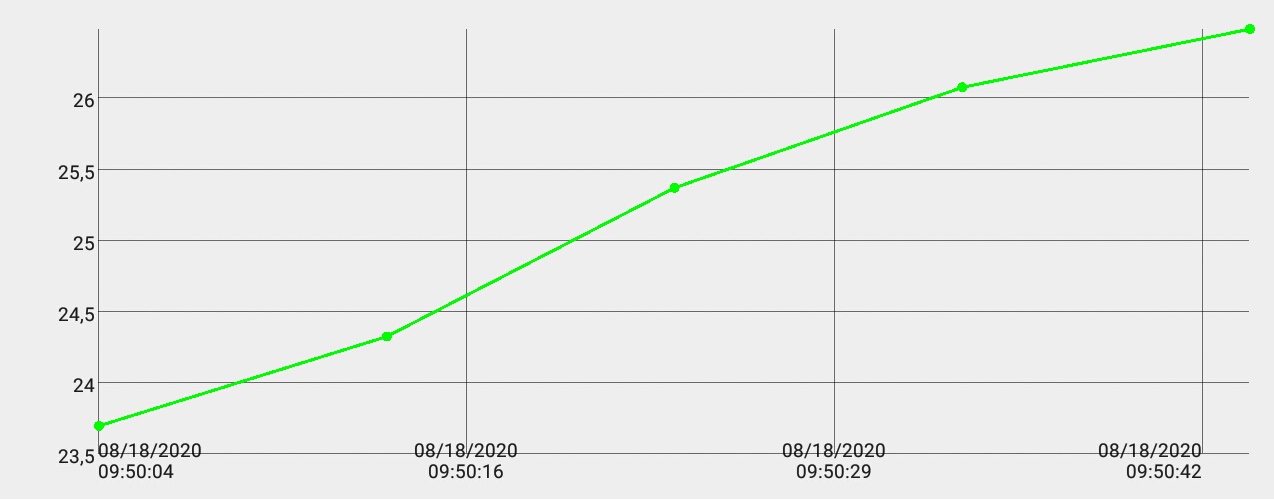
Come potrete notare manca solo un’ultimo passaggio ovvero la conversione Unix timestamp in data e ora comprensibili. La libreria ci viene in contro fornendoci gli strumenti per cambiare manualmente le label degli assi quindi basterà utilizzare quelli per raggiungere il nostro scopo.

mioGrafico.getGridLabelRenderer().setLabelFormatter(new DefaultLabelFormatter(){
@Override
public String formatLabel(double value, boolean isValueX) {
if(isValueX){
//Come mostrare i valori dell'asse x
//Ora legale europa centrale
sdf.setTimeZone(TimeZone.getTimeZone("GMT+2"));
return sdf.format(new Date((long) value * 1000L));
}else{
//Come mostrare i valori dell'asse y
return super.formatLabel(value,isValueX);
}
}
});

Da non dimenticare la creazione dell’oggetto sdf ( SimpleDataFormat ):

SimpleDateFormat sdf = new SimpleDateFormat("MM/dd/yyyy\nHH:mm:ss");


Con questa guida è tutto, se l’articolo vi è piaciuto condividete e restate sintonizzati per non perdervi alti tutorial sul mondo Android.

Database SQLite e Datalogger in Android

Nel post di oggi andremo ad analizzare nel dettaglio i passi da seguire ai fini di realizzare un DataBase SQLite in Android Studio. In particolare il DB da noi realizzato si occuperà di salvare ad intervalli di tempo regolari informazioni in merito a temperatura e tempo, che verranno poi utilizzati per la creazione di un grafico.
Ma andiamo con ordine, per prima cosa aprite un vostro progetto o createne uno nuovo e aggiungete al suo interno una nuova classe che estenda SQLiteOpenHelper come nell’esempio qua sotto

public class DatabaseHelper extends SQLiteOpenHelper { }

A questo punto il compilatore vi obbligherà ad inserire i metodi della classe SQLiteOpenHelper quali il costruttore, onCreate() e onUpgrade(). Il primo si occuperà di creare il DB fisico locale nonchè l’oggetto DatabaseHelper ( II° parametro vuole in ingresso il nome del DataBase ), il secondo si occuperà di creare la tabella all’interno del DB, mentre il terzo si occuperà di fare alcuni accorgimenti nel caso in cui venga modificato il DB fisico locale ( ma non lo tratteremo in questa guida ). La tabella di nome temperature_table che andremo a realizzare sarà composta da tre colonne:

ID Temperatura Tempo
1 23.285 1597753508
2 23.324 1597753510

Per realizzare il tutto a livello software:

private static final String DB_name = "DB_CHART.db";
private static final String TABLE_name = "temperature_table";
private static final String COL_1 = "ID";
private static final String COL_2 = "Temperature";
private static final String COL_3 = "Time";

public DatabaseHelper(@Nullable Context context) {
  super(context, DB_name, null, 1);
}

@Override
public void onCreate(SQLiteDatabase db) {
   String CreationQuery = "CREATE TABLE "+TABLE_name+" ( " +
    COL_1 + " INTEGER PRIMARY KEY AUTOINCREMENT," +
    COL_2 + " REAL," +
   COL_3 + " INTEGER )";
    db.execSQL(CreationQuery);
}

@Override
public void onUpgrade(SQLiteDatabase db, int oldVersion, int newVersion) {
 db.execSQL("DROP TABLE IF EXISTS "+ TABLE_name);
    onCreate(db);
}

Inseriamo i metodi per la lettura, scrittura e cancellazione ( di tutti i dati all’interno della tabella con ripristino ID al valore iniziale, metodo utile solo in questo contesto ).

/**
 * Metodo per scrivere sulla table del Database
 * @param Temperature : temperatura ( double )
 * @param Time : tempo trascorso ( long integer ) - timestamp unix
 * @return true se l'operazione è andata a buon fine, false altrimenti
*/
public boolean saveNewRow(double Temperature, long Time){
    boolean getResult;
    //Ottengo il DB in modalità scrittura
SQLiteDatabase mioDB = this.getWritableDatabase();
//Creo una nuova mappa di valori, in cui i nomi delle colonne sono le chiavi
ContentValues cv = new ContentValues();
//nomeColonna / valore
cv.put("Temperature",Temperature);
cv.put("Time",Time);
//Eseguo l'inserimento nella tabella
try{
mioDB.insert(TABLE_name,null,cv);
getResult = true;
}catch(SQLException sqle){
//Caso in cui l'inserimento non è andato a buon fine
sqle.printStackTrace();
getResult = false;
}
//Chiudo il db ( aperto in modalità scrittura )
   mioDB.close();
    return getResult;
}

/**
* Metodo per ottenere tutti i dati presenti all'interno della tabella temperature_table
* ( anche se alla fine tengo conto solo delle colonne Time e Temperature )
* @return : DataPoint[]
*/
public DataPoint[] getAllData(){
//Ottengo il DB in modalità lettura
SQLiteDatabase mioDB = this.getReadableDatabase();
//Creo un oggetto Cursor per selezionare tutti i dati all'interno della tabella
Cursor mioCursor = mioDB.rawQuery("SELECT * FROM "+TABLE_name,null);
//Istanzio DataPoint di dimensione pari a mioCursore.getCount() ( ovvero pari al numero di
// righe )
DataPoint[] mieiDataPoint = new DataPoint[mioCursor.getCount()];
//Con questo ciclo creo i vari datapoint (x,y) e prendo min e max di entrambi gli assi
for(int i = 0; i < mioCursor.getCount(); i++){
mioCursor.moveToNext();
if (i == 0){
MinX = mioCursor.getInt(mioCursor.getColumnIndex("Time"));
MinY = mioCursor.getDouble(mioCursor.getColumnIndex("Temperature"));
}
if(i == (mioCursor.getCount()-1)){
MaxX = mioCursor.getInt(mioCursor.getColumnIndex("Time"));
MaxY = mioCursor.getDouble(mioCursor.getColumnIndex("Temperature"));
}
mieiDataPoint[i] = new DataPoint(mioCursor.getInt(mioCursor.getColumnIndex("Time")),mioCursor.getDouble(mioCursor.getColumnIndex("Temperature")));
}
//Chiudo il db ( aperto in modalità lettura )
mioDB.close();
return mieiDataPoint;
}

/**
 * Metodo per cancellare tutte le righe del database, riporta anche l'autoincrement ( ID ) al
 * valore iniziale
 */
public void eraseEverything(){
//Ottengo il DB in modalità scrittura
SQLiteDatabase mioDB = this.getWritableDatabase();
//Elimino tutte le righe
mioDB.execSQL("DELETE FROM "+TABLE_name);
//Ripristino ad 1 l'autoincrement ID
mioDB.execSQL("UPDATE SQLITE_SEQUENCE SET SEQ=0 WHERE NAME='"+TABLE_name+"'");
//Chiudo il DB ( aperto in modalità scrittura )
mioDB.close();
}

Nel nostro caso con il metodo getAllData() estraiamo i dati e li passiamo ad un vettore di DataPoint[ ] in quanto il loro utilizzo è limitato solo alla creazione di un grafico, nulla vieta che i dati possano essere estratti e passati a variabili di altro tipo. Il consiglio è quello di non passare mai l’oggetto Cursor ( anche se l’applicativo funzionerebbe comunque ). Ricordarsi sempre di chiudere il DB ( aperto in modalità lettura/scrittura ).
Adesso non rimane altro che creare l’oggetto DatabaseHelper dove vi serve per avere accesso a tutti i metodi.

//Creazione oggetto mioDBHelper nell'onCreate() della main activity
mioDBHelper = new DatabaseHelper(this);

ADB and micro USB for data communication

ADB stands for “Android Debug Bridge” and it basically just allows you to send commands to your device Ltouch.

Download SDK Platform Tools ADB is a small tool bundled in the Android SDK as part of the “Platform Tools.”

ADB stands for “Android Debug Bridge” and it basically just allows you to send commands to your device.

Users used to be required to download the entire SDK (which is very large) just to use ADB, but Google now allows users to download only the Platform Tools.

  • Download the SDK Platform Tools for Windows, Mac, or Linux from https://developer.android.com/studio/releases/platform-tools.html
  • Extract the ZIP file somewhere easily accessible (like C:\platform-tools) We’ve got ADB downloaded on your computer and your Android device is ready to receive instructions.
  • Now it’s time to put it all together and run your first ADB command.
  • Connect your Ltouch to the computer with a USB cable
  • The USB mode must be PTP in order for ADB to work. You can usually change this from the notification shade
  • Make sure to allow USB debugging if a pop-up appears
  • Open the platform-tools folder on your computer
  • Shift+Right Click and select Open command prompt here
  • Type adb devices and hit Enter

That’s all, good work

Websoket with server inside Android HMI Ltouch

In 2018 eight out of ten people have a smartphone, so it is a great achievement to share data acquired by our Android HMI Ltouch
(such as the measure of a temperature) over a wireless network and look at it with a web browser.

Let’s see how using an Ltouch 7, there are only 2 steps:

Step 1
Install an http server to provide the webpage with measures; in our tests we used Http Server by Tautvydas Andrikys, it is very interesting
because it can support php after the installation of Server for PHP by the same author. Once installed these apks, tap “server address and port” to set
an http port ,default is 8000, you can change but do not use privileged ports (ports below 1024 , see for example ), then choose ip address 0.0.0.0 to answer on each ip assigned to the Ltouch.

Enable php support:

CGI setting -> enable com.esminis.server.php (Server for PHP)

Finally enable start on boot.

Copy webpage index2.html to /mnt/sdcard/htdocs/public :
adb push index2.html /mnt/sdcard/htdocs/public
Copy configuration files for php server php.ini to /mnt/sdcard/www/config :
adb push index2.html /mnt/sdcard/www/config
Copy configuration files for http server: certificate.cert / certificate.key / httpd.conf to: /mnt/sdcard/htdocs/config
adb push certificate.cert /mnt/sdcard/htdocs/config
adb push certificate.key /mnt/sdcard/htdocs/config
adb push http.conf /mnt/sdcard/htdocs/config

Reboot touch.

However you can use any http server.
Enable hotspot in the settings of Ltouch: settings -> more -> portable hotspot , here we can setup wifi parameters : network name and
password, then tap on portable hotspot to enable it

Step 2
install the apk available in the download area; it’s a simple app which uses modbus library by Biemme to read the measure of a temperature
provided by an external device and connected to the rs485 port of the touch

Now using your pc or smartphone, you can connect to the wifi network just created: open a browser and type http://192.168.43.1:8000/index2.html
in the address bar, note that you must use the port set in the http server in the address, we are using 8000, if you set another value use that
instead of 8000.

Moreover, the duo webpage/application allow us to handle input/output pins handled by Android kernel on the side of Ltouch, the ones provided
by expansion boards are handled with modbus calls and are excluded.

Source codes are available in our download area

Nuovo HMI Ltouch Plus

E’ in arrivo un nuovo pannello HMI touch screen 7″ sistema operativo Android 5.1 con ingressi ed uscite a bordo.

16 Ingressi/Uscite digitali, 4 ingressi analogici configurabili con risoluzione 16bit, 4 uscite analogiche 0..10 Volt / 4..20 mA.

Display capacitivo 7″ HD con risoluzione 1280×800 e protezione IP54. Monta un processore quad core A9 con frequenza scalabile da 400 a 1.4 G Hz.

Verrà distribuito con una libreria nativa per un facile e veloce gestione degli ingressi/uscite.